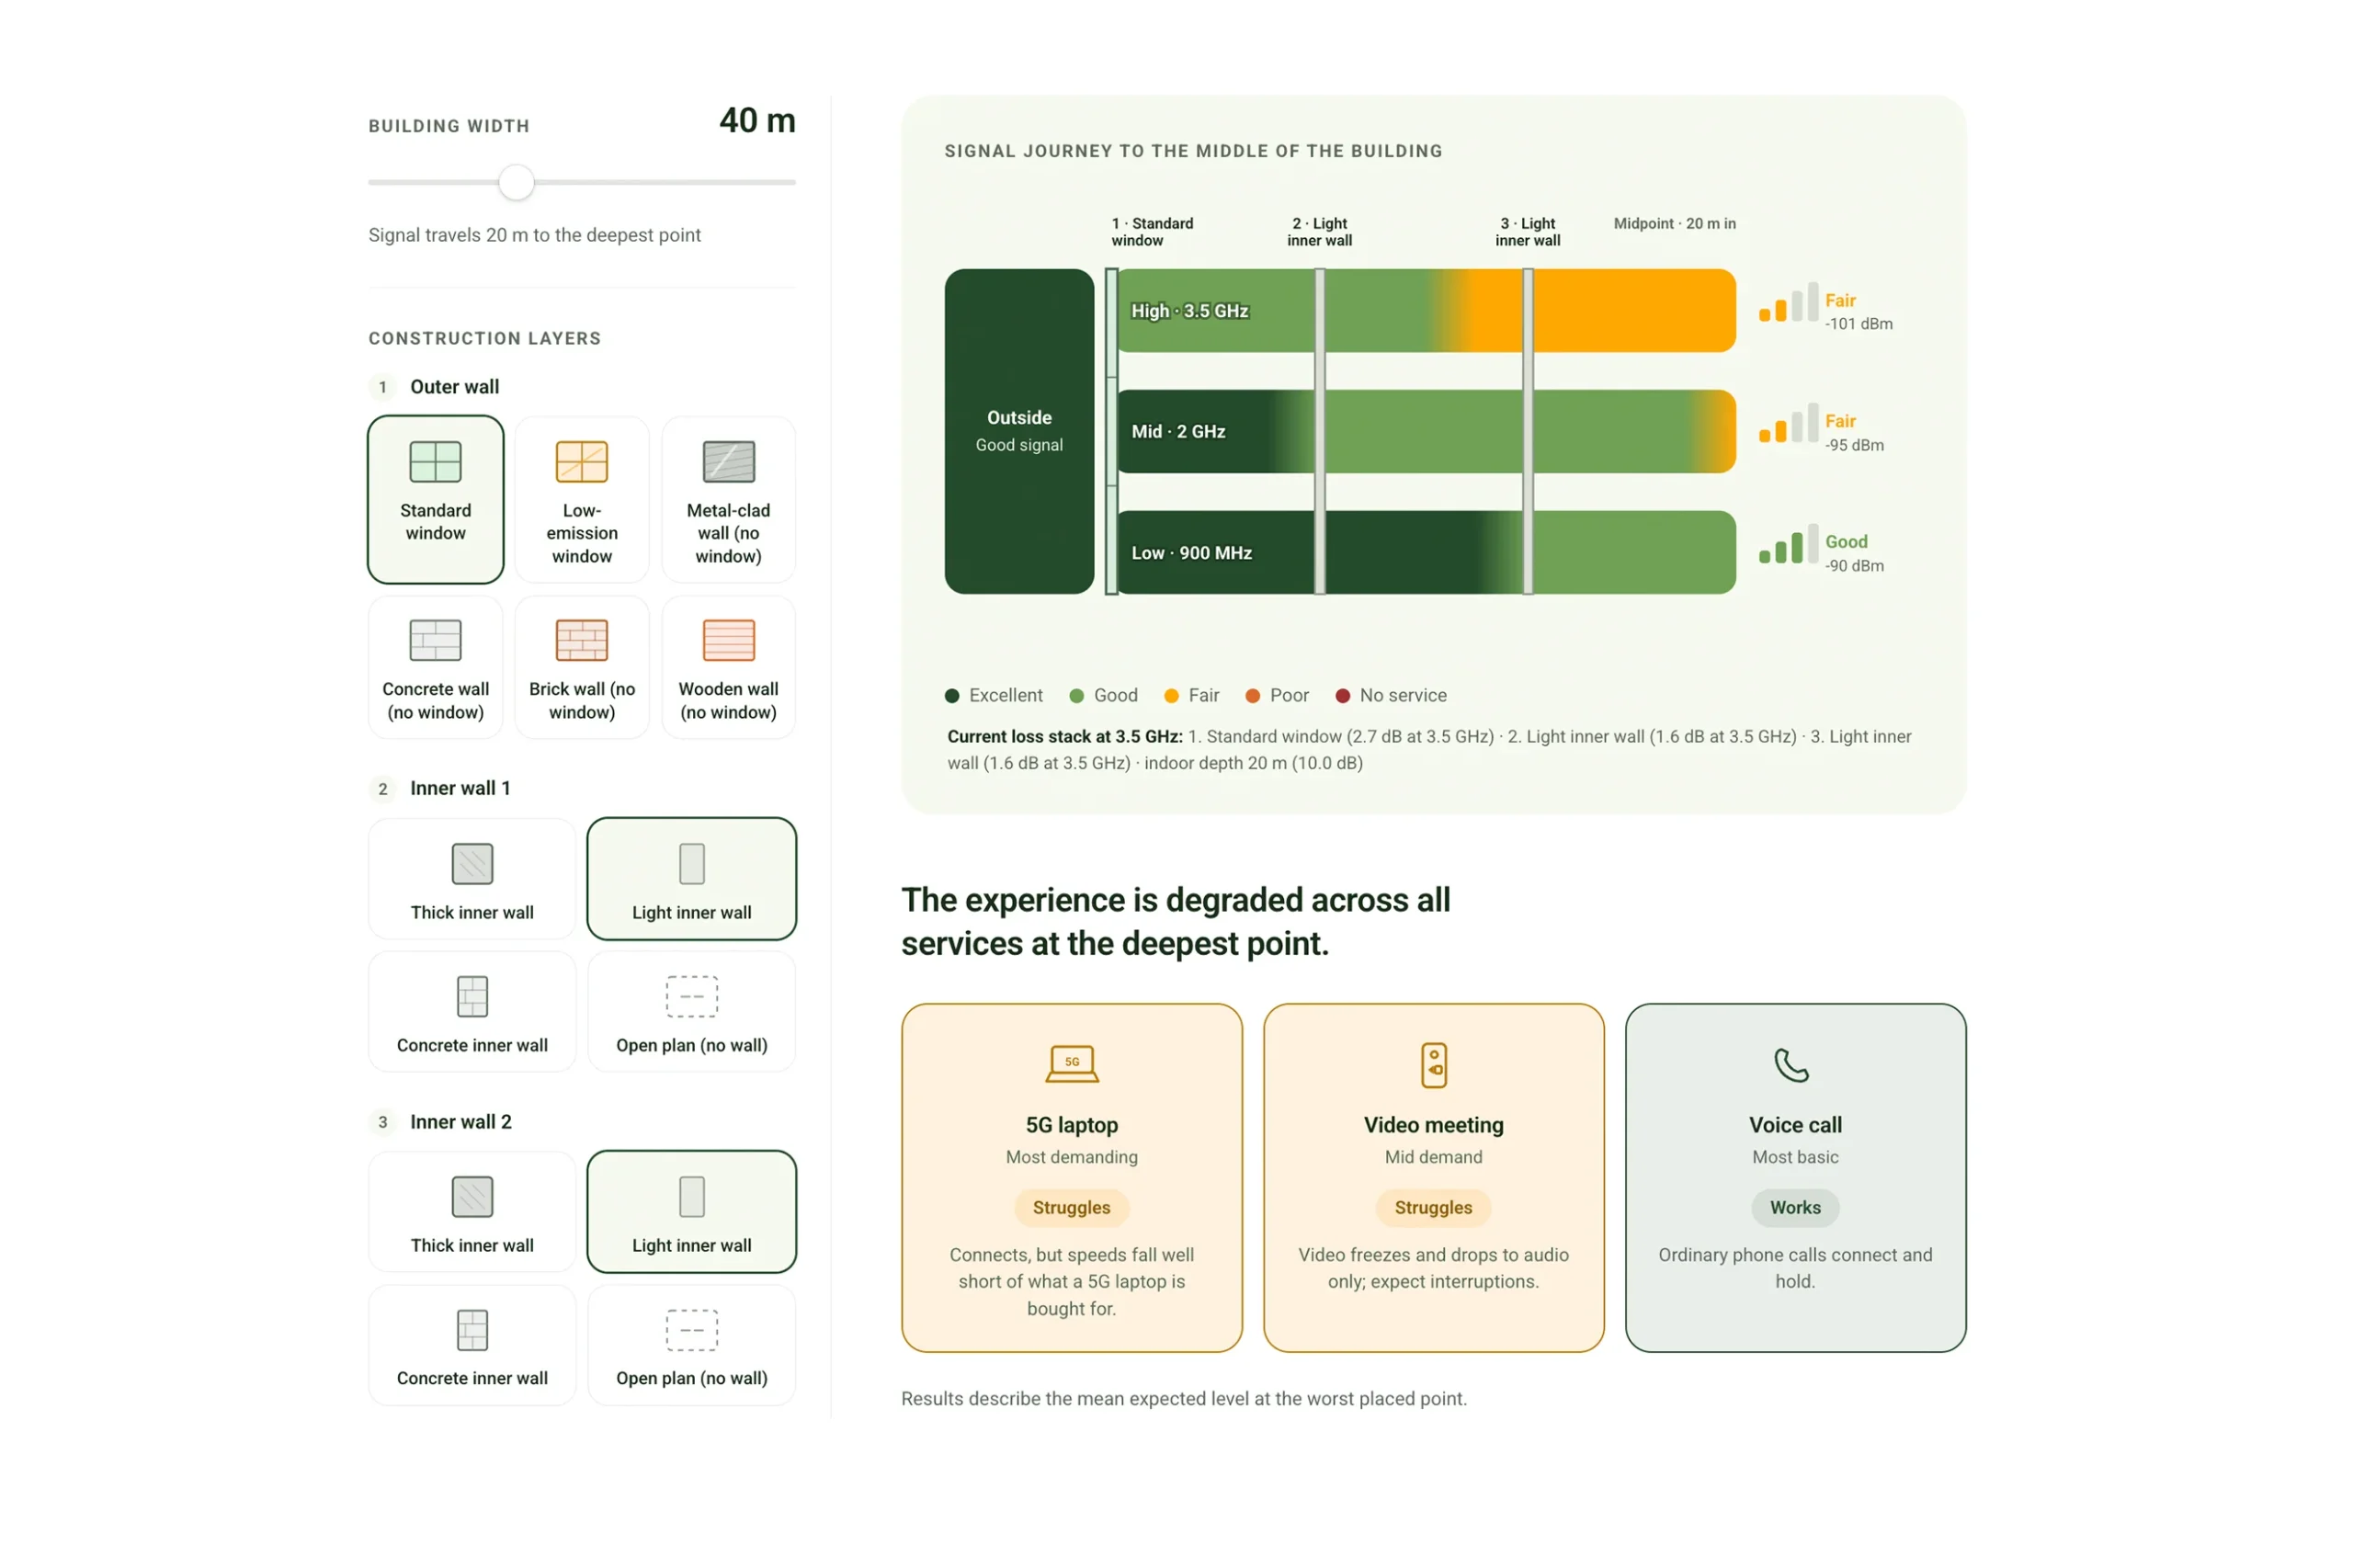
This estimator applies the outdoor-to-indoor building penetration model from 3GPP TR 38.901, clause 7.4.3.1 (Study on channel model for frequencies from 0.5 to 100 GHz). Total indoor loss is the sum of the penetration loss of each material layer plus an indoor depth loss of 0.5 dB per metre travelled inside the building.
Material penetration losses (f in GHz):
| Material | Loss formula | 0.9 GHz | 2 GHz | 3.5 GHz |
|---|
| Standard multi-pane glass | 2 + 0.2f | 2.2 dB | 2.4 dB | 2.7 dB |
| Low-emission (IRR) glass | 23 + 0.3f | 23.3 dB | 23.6 dB | 24.1 dB |
| Metal-clad wall (no window) | 40 + 0.5f | 40.5 dB | 41.0 dB | 41.8 dB |
| Concrete wall (outer or inner) | 5 + 4f | 8.6 dB | 13.0 dB | 19.0 dB |
| Brick wall (no window) | 8.5 + 0.3f | 8.8 dB | 9.1 dB | 9.6 dB |
| Wooden wall (no window) | 9.7 + 0.24f | 9.9 dB | 10.2 dB | 10.5 dB |
| Light wall (dry wall) | 1.03 + 0.17f | 1.2 dB | 1.4 dB | 1.6 dB |
| Steel-plated wall (fire/safety) | 25 + 0.4f | 25.4 dB | 25.8 dB | 26.4 dB |
| Open plan (no wall) | 0 | 0 dB | 0 dB | 0 dB |
Standard window, low-emission window, and concrete are the official penetration loss coefficients from 3GPP TR 38.901, clause 7.4.3.1. Metal-clad, brick, wooden wall, and the steel-plated inner wall have no published 3GPP coefficient. These are engineering estimates grounded in published attenuation ranges (NIST and industry references), deliberately set toward the higher-loss end so the tool doesn’t overstate expected coverage. The steel-plated wall uses the same conductor reasoning as the metal-clad exterior: continuous steel is close to opaque to RF. The figure is scaled down from the exterior cladding value to reflect a lighter single-skin partition or fire door rather than a full insulated facade panel. Concrete uses the same figure for both the outer wall and inner wall options, since no official lighter figure exists for internal blockwork.
Outdoor signal levels assumed (RSRP, dBm):
| Outdoor signal | Low band 900 MHz | Mid band 2 GHz | High band 3.5 GHz | Indicative RSRQ |
|---|
| Good | -75 | -80 | -85 | around -9 dB |
| Patchy | -96 | -100 | -104 | around -13 dB |
| Poor | -106 | -110 | -114 | around -17 dB |
Outdoor levels are set lower for higher frequencies to reflect typical macro network propagation, and each preset is anchored so that all three bands sit on the same step of the quality scale outdoors (Good = excellent, Patchy = fair, Poor = poor). These anchors are configurable assumptions, not 3GPP values.
Experience thresholds at the midpoint (RSRP, dBm):
-85 or better is Excellent (level 4); -85 to -95 Good (level 3); -95 to -105 Fair (level 2); -105 to -115 Poor (level 1); below -115 No usable service (level 0).
How service verdicts are derived:
Each frequency band gets a signal level (0 to 4) at the midpoint. Services are then judged on the bands they realistically depend on. Demanding data services need the high capacity bands, while voice can fall back to whichever band survives best.
| Service | Works | Struggles |
|---|
| 5G laptop (most demanding) | High band at level 3+ | High band at level 2, or mid band at level 3+ |
| Video meeting on phone (mid) | High or mid band at level 3+ | High or mid band at level 2, or low band at level 3+ |
| Voice call (most basic) | Any band at level 2+ | Any band at level 1 |
Anything below the struggles threshold is shown as fails. These mappings are pragmatic simplifications intended to make the physics relatable, not network guarantees.
Simplifications:
- Perpendicular incidence is assumed. TR 38.901 adds a further loss for non-perpendicular angles, so real conditions are often worse than shown.
- Shadow fading (standard deviation 4.4 to 6.5 dB in the 3GPP model) is not applied. Results are a mean estimate.
- A single straight signal path through the stated layers is assumed. Real floors have furniture, risers, lift cores and people, all of which add loss.
- Higher frequency bands carry most of a modern network’s capacity. Even where a low band signal survives to the midpoint, the achievable speed on that band alone is limited.
- Only three of the nine material options above are official 3GPP coefficients. The rest are conservative estimates in the absence of a published figure (see note above the material table).
https://www.3gpp.org/ftp/Specs/archive/38_series/38.901/


 United Kingdom
 Italy
Italy
 Norway
 Denmark
 Sweden